Atlas maps out political divide
A political atlas of Switzerland on CD-Rom, published on Friday, provides an insight into attitudes and voting patterns of multi-cultural Switzerland.
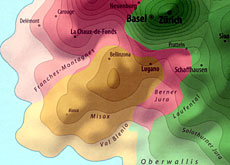
It reveals that the “Röstigraben” – the name given to the linguistic and cultural divide between French- and German-speakers – is not as strong today as it was 100 years ago.
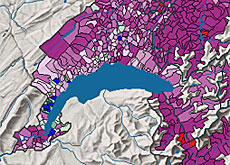
The atlas divides Switzerland along political lines using the results of nationwide votes going back to 1866 and cabinet elections since 1919.
It also includes information from district and communities dating from the 1970s onwards – leading to more than 2,000 interactive maps.
Pascal Sciarini, professor of politics at the Swiss Graduate School of Public Administration in Lausanne, said the atlas was arranged thematically and covered topics such as social policy, economics and culture.
This allowed for a better overview of the political attitudes in the country, said Sciarini.
Röstigraben
The atlas showed that, despite the ongoing debate about the cultural divide, the “Röstigraben” was actually much more in evidence in the 19th century.
Then, the ideological differences between the German-speaking part of the country and French and Italian-speaking regions was evident in two thirds of election results.
In the 20th century, only social and foreign policy issues generally continued to divide linguistic regions, with between ten and 30 per cent of votes showing such patterns.
Religion also played a role in the 19th century. Between 60 and 80 per cent of the vote results for that period revealed a clear difference between voters in the Catholic and Protestant regions.
Nowadays, such a difference is rare, coming to the surface only on issues such as abortion.
But Sciarini said that, over the past 12 years, evidence has been emerging of a growing divide between urban and rural areas, with the former tending towards more “liberal” thinking while the latter were more conservative.
Experts said election and vote results were considered to be a valuable indicator of public opinion. At present, two million people are eligible to vote in Switzerland, out of a population of 7.4 million, 20 per cent of whom are not Swiss citizens.
swissinfo with agencies
The atlas has 2,000 different maps from more than 1,000 election and vote results.
Vote results from 1866 are included.
Cabinet election results date from 1919.
The maps show results from communities and districts for elections since 1971.
Vote results from communities and districts date from 1981.

In compliance with the JTI standards
More: SWI swissinfo.ch certified by the Journalism Trust Initiative
You can find an overview of ongoing debates with our journalists here. Please join us!
If you want to start a conversation about a topic raised in this article or want to report factual errors, email us at english@swissinfo.ch.