Graphics to guide you through the climate talks
This series of graphics with the latest climate data help make sense of the Paris climate summit and understand the challenges of reaching a global agreement.


The United Nations weather agency, which is home to the Intergovernmental Panel on Climate Change (IPCC), the world’s top scientific authority on global warming, says it is likely that the world has now warmed by 1°C over pre-industrial times.
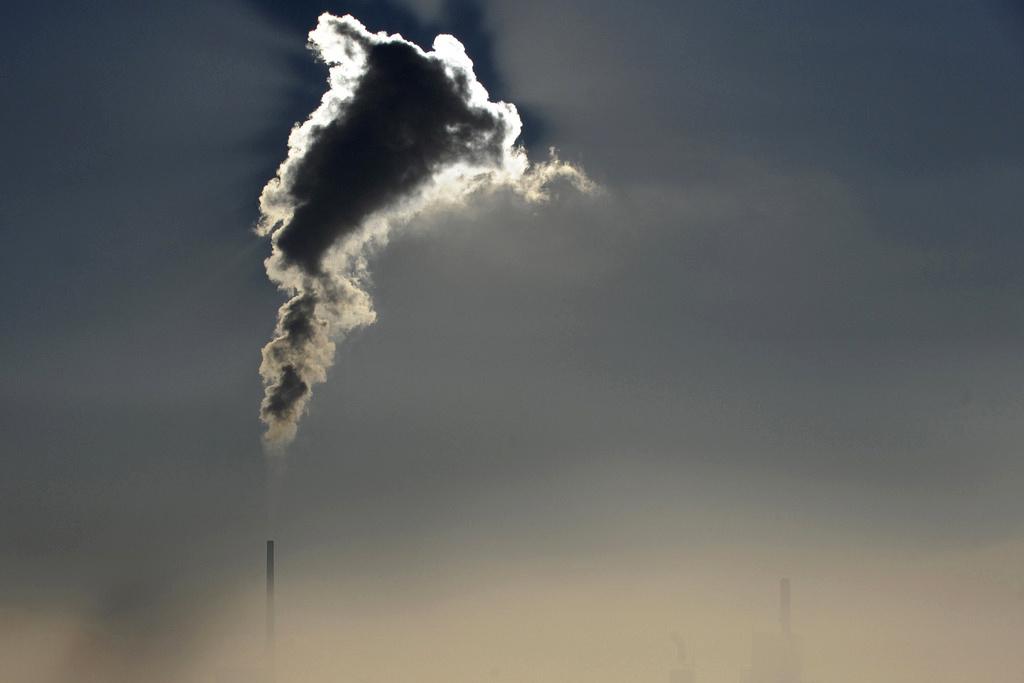
More carbon emissions bring rising temperatures, changing seasons, higher sea levels and more frequent catastrophic weather events.
To limit those emissions, the IPCC recommends – and world leaders in 2009 agreed to adopt as a goal – no more than 2ºC warming above pre-industrial levels. The IPCC “carbon budget” for achieving that goal contains an amount of allowable emissions.
Ahead of the Paris “COP21” climate talks, Switzerland was the first country to tell the UN how much it would cut emissions. Countries use a variety of ways to calculate their pledged contributions – adding to the difficulty of attaining a new international climate treaty. World leaders hope to reach agreement requiring action by all 195 nations plus the European Union, not just the richest ones as was the case with the first phase of the 1997 Kyoto accord, which expired in 2012.
Some difficult questions will be raised during COP21. How much should global emissions be cut? What actions should each country take? How much financial aid should wealthier nations like Switzerland offer to poorer nations to adapt to global warming?
CO2 emissions, the blame game
Whenever global warming is discussed, a broad range of calculations about CO2 and other warming gases are never far behind.
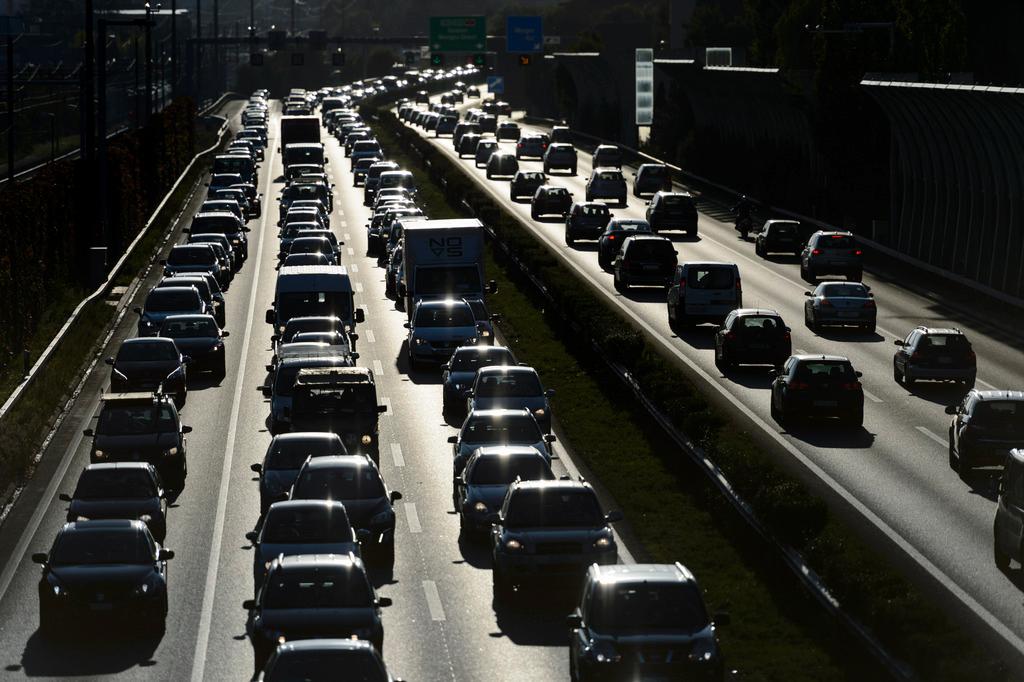
Total emissions by China or the United States vastly eclipse those by small countries such as Switzerland. For the sake of comparison, emissions are often calculated on a per capita (person) and economic (Gross Domestic Product, or GDP) basis.
Since the majority of CO2 emissions come from developing countries, there is tension over how much historical responsibility should be taken by countries that have already benefited from fossil fuel-burning industrialisation. The graphic below illustrates how much wealthy nations have historically contributed to carbon emissions compared to other countries.
Developed nations such as Europe and the United States are responsible for about half of all carbon from fossil fuels since 1850. The chart above helps explain why some nations feel they are owed financial aid to adapt. By contrast, rich nations like Switzerland emphasise rising per-capita emissions in developing countries. Rich nations have been helped by a shift to a service economy to reduce their emissions. The global financial crisis of 2008-09 also helped Europe and other countries meet their carbon targets by lowering economic output.
Outsourcing of carbon emissions
And though Europeans have decreased their carbon emissions over the last decades, the Global Carbon Budget 2014 reportExternal link notes that virtually all the cuts made by wealthy countries like the US and Europe since 1990 were offset by “outsourced” emissions to places like China.
Another thorny issue is who is responsible for carbon emissions from consumer goods such as the ubiquitous smartphone, TVs and other household goods: the country that makes an item or the one that consumes it? That is a complicated issue, but it is possible to account for emissions from goods and services produced in one country and consumed in others.
Considering the consumption emissions per capita instead of production emissions produces a very different picture for wealthy nations. Figuring in the carbon “transfer” from trade, Switzerland emits more than 3 times its production emissions per capita – and ranks among the top carbon emitters per capita.
Greenhouse gas
Gases that trap heat in the atmosphere like a greenhouse are commonly known as greenhouse gases. Some occur naturally, like water vapor, carbon dioxide, methane (CH4), nitrous oxide (N2O) and ozone (O3) Other such gases are man-made, like chlorofluorocarbons (CFCs), hydrofluorocarbons (HFCs), perfluorocarbons (PFCs) and sulfur hexafluoride (SF6). And though chlorofluorocarbons are the strongest greenhouse gas per molecule, CO2 is by far the most prevalent. Along with CH4 and N2O, it accounts for 98% of all greenhouse gas emissions. CO2 is measured by the ton, which would fill a small house with about 116 square meters in floor space and 4 meters high.
Links
- United nations conference on climate change (COP21)External link
- CAIT Paris Contributions MapExternal link
- Intergovernmental Panel on Climate ChangeExternal link
- CAIT Climate Data ExplorerExternal link
- The Global Carbon AtlasExternal link

In compliance with the JTI standards
More: SWI swissinfo.ch certified by the Journalism Trust Initiative


You can find an overview of ongoing debates with our journalists here . Please join us!
If you want to start a conversation about a topic raised in this article or want to report factual errors, email us at english@swissinfo.ch.