


Coronavirus: the latest numbers
Here is an overview of the most important Swiss-related coronavirus data and graphs, which are updated automatically.
Please note: as of May 24, 2022, this article as well as the figures and graphics in it are no longer being updated. The latest figures on Covid-19 in Switzerland can be found on the Federal Office for Public Health’s dashboardExternal link.
External Content
External Content
External Content
How fast is the coronavirus spreading in Switzerland? We publish a series of graphs on this page, which are updated as new data becomes available. Since April 2022, this now only happens once a week, on Tuesday afternoon (Swiss time). The sources and the methodology behind the graphs can be found at the end of the article.
External Content
Situation in Switzerland
The current spread of SARS-CoV 2 is only very poorly represented by the existing data on new infections. A much higher number of unreported cases is to be expected. One of the indicators of this is the high positive rate. For these reasons, and because many people are no longer getting tested despite symptoms, the figures for new infections (which also include second and third infections) should be interpreted with great caution. A better indication are the hospital admissions. These show how many people are admitted to hospital every day because of or with Covid 19. The following applies to both new infections and hospital admissions: if broken down by day, they are not very meaningful, as they are subject to strong fluctuations. We therefore recommend focusing on the general development.
External Content
For the new infections data to be meaningful and for the situation to be correctly assessed, sufficient tests are needed. The available data on the tests show that testing regimes of the cantonal authorities are subject to fluctuations.
External Content
Until now, another important indicator was the proportion of positive tests in all tests carried out, the so-called positive rate. This gave an indication of whether the reported new infections were a good reflection of the situation. If the WHO threshold of 5% was not exceeded, it could be assumed that a large proportion of cases had been detected. The situation has now changed, but the positive rate is still an indication of how broadly testing is currently taking place.
External Content
Until the emergence of the Omicron variant, it was generally the case that with a rise in new infections, hospital bed occupancy with Covid-19 cases increased around two to three weeks later. But with Omicron there has been a decoupling of hospital admissions and especially intensive care cases from new infections.
According to The Federal Office of Public Health (FOPH), around 85% of those hospitalised with Covid-19 since the start of the pandemic have at least one existing illness.
More people are expected catch Omicron in hospital than with previous variants. The FOPH statistics also account for people admitted to hospital with a different diagnosis, but then test positive for coronavirus.
External Content
A good indicator of the end of a wave is the decrease in daily reported deaths related to Covid-19.
External Content
External Content
The global picture
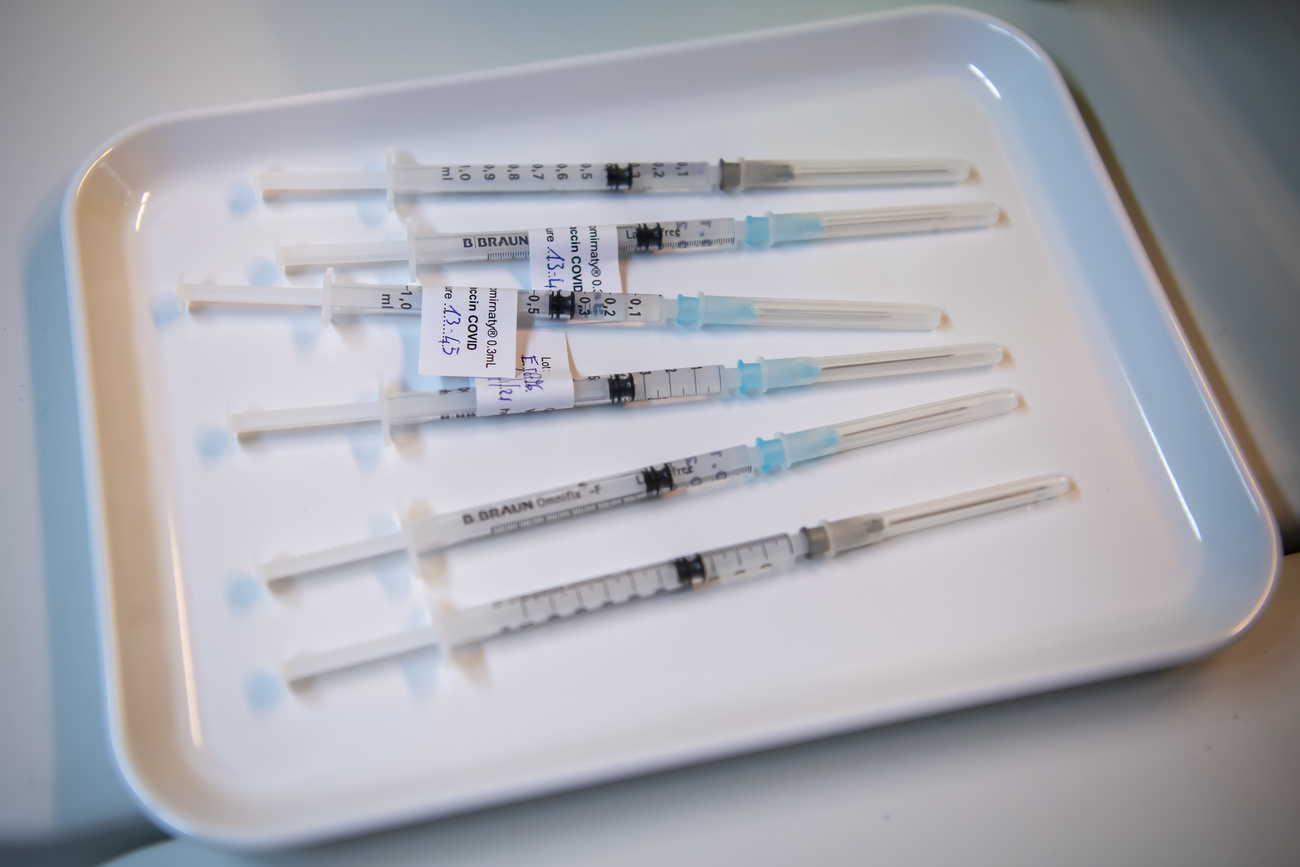
The first countries to administer vaccines started in mid-December 2020, but it could be months or even years before between 50-75% of the population is vaccinated, achieving so-called herd immunity according to various studies. For most vaccines, two doses at least three weeks apart are needed to ensure long-lasting protection. The graph below shows the number of people that have received at least one dose as vaccination regimes vary. For an international comparison we use data from Johns Hopkins University and Our World in Data.
External Content
External Content
In Switzerland, statistics on the spread of coronavirus come from different sources. Most of the data comes from the 26 cantons, but it is also published once a day by the Federal Office of Public Health (FOPH)External link. For the number of coronavirus-related deaths, FOPH sometimes publishes statistics a few days later than the cantons.
Until July 8, SWI swissinfo.ch only published consolidated figures that came directly from the cantons. The source for these figures is an interface run by the Statistics Office of Canton ZurichExternal link, which meets high standards of data quality and availability. Since July 9, SWI swissinfo.ch once again used the FOPH as the source for the number of confirmed cases, as some cantons no longer publish the figures on a regular basis. The statistics for some cantons may be missing due to a delay in reporting figures to the federal health authorities. (The Swiss health authorities also report data for Liechtenstein. FL refers to Fürstentum Liechtenstein.) Since 23 December, for the sake of consistency, the FOPH data has also been used for the figures on deceased persons.
For the international comparison, we use data from Johns Hopkins University, except where figures for Switzerland are shown. For the sake of consistency, data from the FOPH are also used here.
Data on global case and immunization is aggregated and updated daily by the online scientific publication Our World in DataExternal link.

More
Coronavirus: the situation in Switzerland

In compliance with the JTI standards
More: SWI swissinfo.ch certified by the Journalism Trust Initiative
You can find an overview of ongoing debates with our journalists here . Please join us!
If you want to start a conversation about a topic raised in this article or want to report factual errors, email us at english@swissinfo.ch.